
Below are some examples of front end, back end, and full stack data analysis and data visualization programs and web apps that I’ve put together
Full Stack
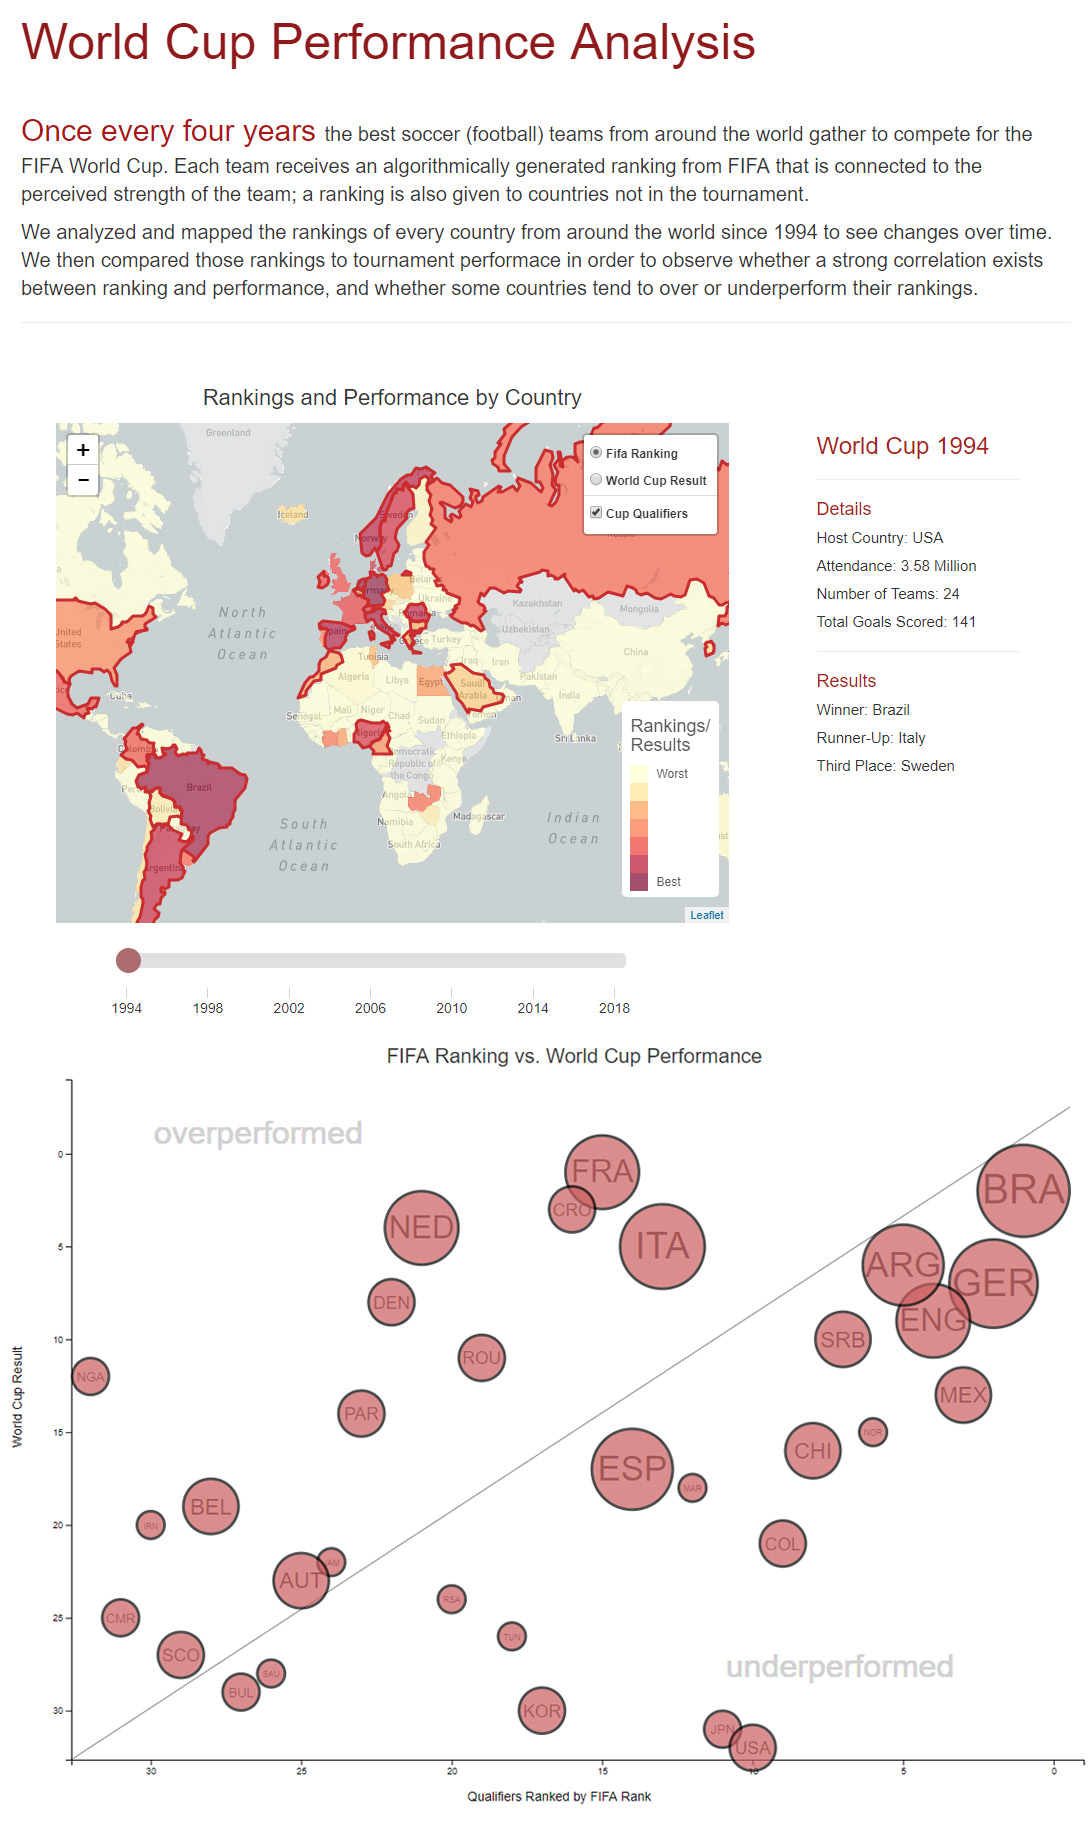
FIFA World Cup Rankings and Performance Analysis
Technologies: sqlite, Python, Flask, D3, Javascript, GeoJson, Leaflet, Bootstrap, Pandas, Jupyter Notebook
This full-stack application is built on a sqlite database backend. API routes were created in Python using Flask; these routes were then called in JavaScript to build an interactive map using Leaflet, and an interactive scatterplot of rankings vs. World Cup Performance using D3, along with information on the World Cup for that year. The frontend layout was done using the Bootstrap framework.
Using a slider, a World Cup year can be selected and data from that year can be viewed. The map can be overlaid with every country’s FIFA ranking, along with World Cup performance for each team that made the World Cup. The slider will also modify the scatterplot, where the tournament performance of all World Cup teams are plotted vs. entering ranking to view which teams over or under-performed. The data goes up to (but not including) World Cup 2018.
The initial data was cleaned and the database was set up using Pandas running in a Python Jupyter Notebook environment.
Font End
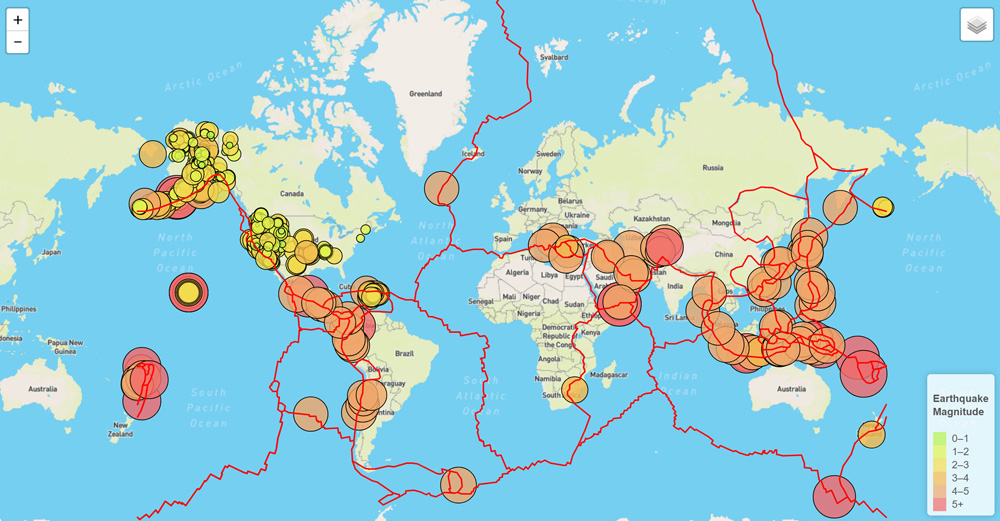
World Map of Earthquakes
Full working app: www.aaronburke.net/earthquakes/index.html
Technologies: JavaScript, Leaflet, GeoJson, API calls
This program queries the US Geological Survey for a GeoJson of all earthquakes in the past 7 days. Using JavaScript and Leaflet, each earthquake is then mapped with the color and size of each circle relative to the magnitude of the earthquake. A user can also select to display lines of tectonic plates, and each earthquake circle is clickable which will display additional information.
Back End
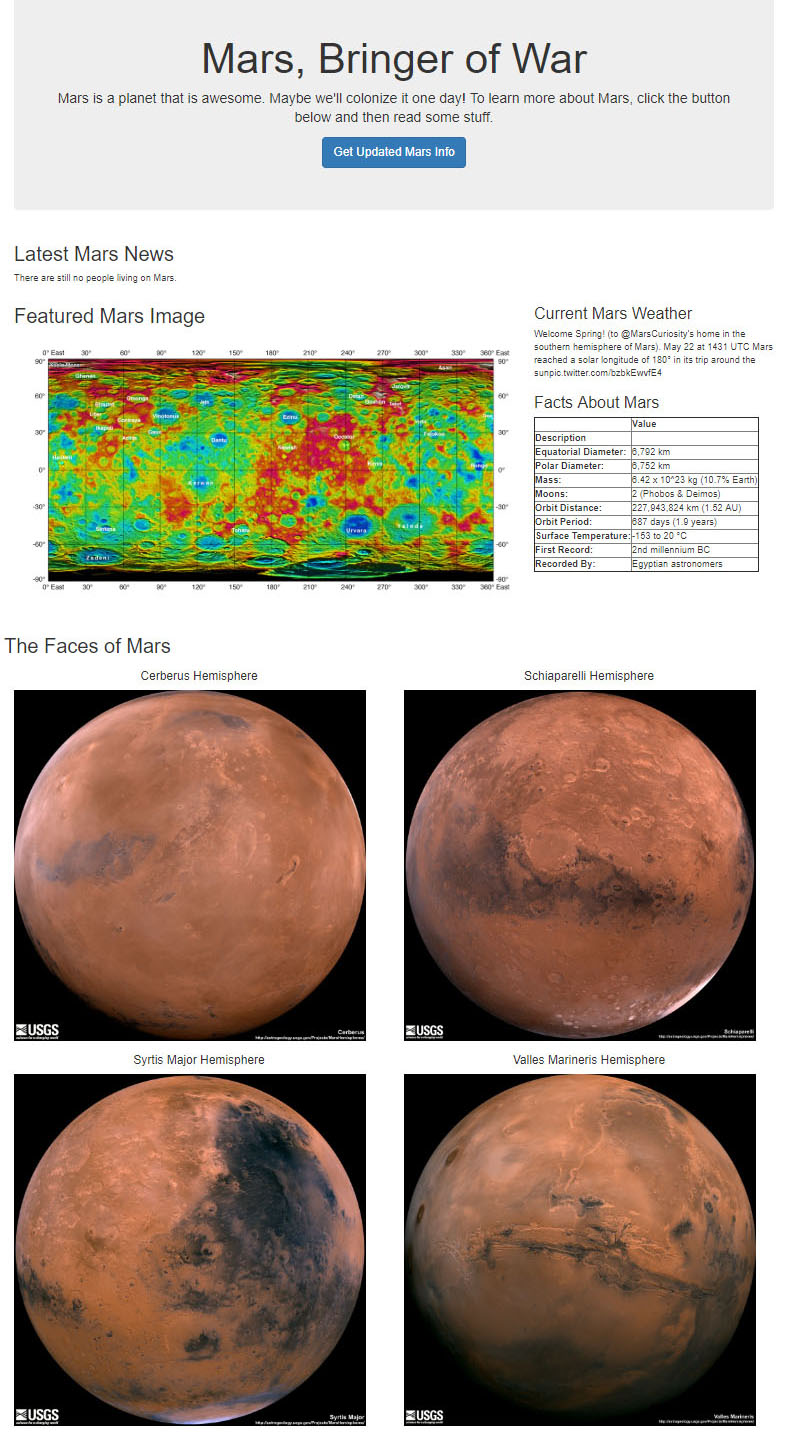
Multi-Site Web Scraping Display
I’m calling this back-end because there is no Javascript powering the front-end web display; just some basic HTML/CSS in a Bootstrap framework
Technologies MongoDB, PyMongo, Flask, Python, BeautifulSoup, Splinter, Selenium, Pandas
This is a multi-site web scraping program. Splinter and Selenium are used to drive a browser programmed to scrape data on Mars from the USGS, Space Facts, NASA, and the Mars Weather Report Twitter account. Content is parsed for use using BeautifulSoup, and results are loaded into a Mongo non-relational database. When a user clicks the “scrape” button, the program executes and scrape for the most recent data on each site and updates the display.
This was a fun exercise in practical web scraping.