Weather and Latitude Data
Summary: This project pulled data using the OpenWeatherMap API from a random set of cities scattered across various latitudes of the world, and then analyzing weather data for each city location.
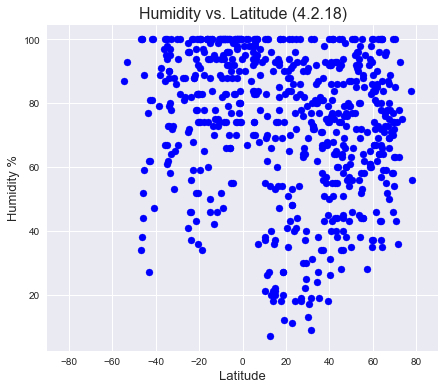
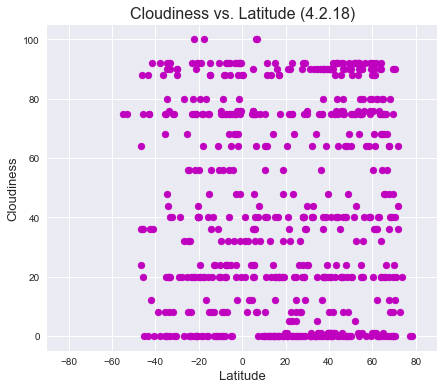
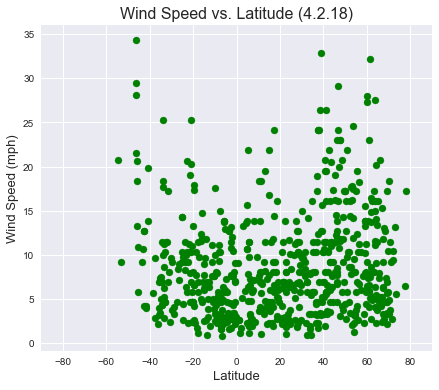
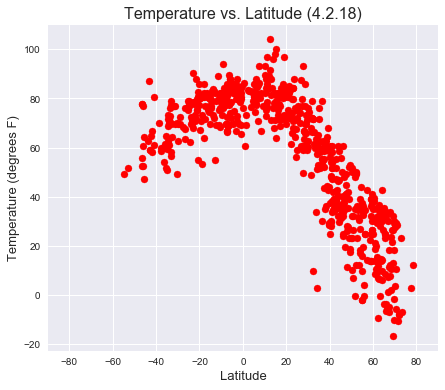
By analyzing weather data across several hundred cities in various latitudes of the world, we could then plot weather patterns vs. latitude. This project examined temperature, humidity, cloudiness, and windiness at one specific timepoint, and then plotted the results.
Method: A random set of approximately 2000 latitude and longitude coordinates was created using NumPy. Each of these coordintes were then matched to the city with latitude and longitude coordinates most closely matching. Duplicate cities were removed, leaving approximtely 750 city coordinates remaining. Using an API call to OpenWeatherMap current conditions for temperature, humidity, wind speed, and cloudiness were taken (on 4/2/18) and fed into a Pandas dataframe.
Using MatPlotLib and the Seaborn visualization library, each of the four weather conditions was plotted vs. latitude to examine the correlation, if any, between latitude and weather conditions. More detailed analyses of each weather condition can be seen on each visualization page.
Visualizations